Live NOAA OVATION · North & South
Live Aurora Map for Tonight
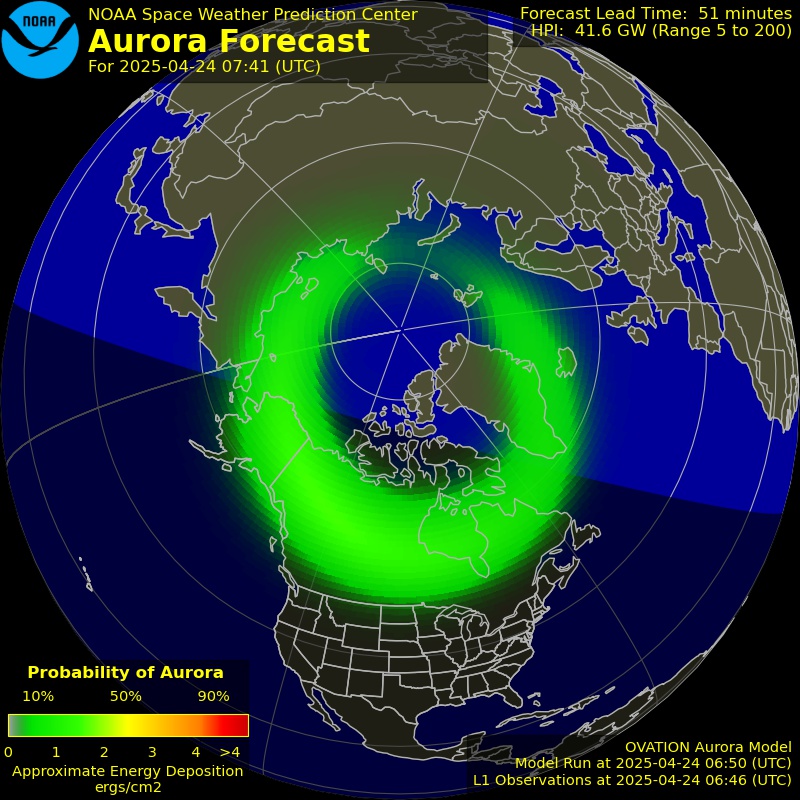
Follow the official NOAA auroral oval in both hemispheres, confirm the UTC forecast time and add current Kp context before checking conditions near you.
Live map temporarily unavailable Use the timestamps below and try again shortly.
Official NOAA SWPC OVATION 30-minute forecast. The colored oval models auroral activity; it is not a local visibility percentage.
Open NOAA source ↗Find a Northern Lights Forecast Near Me
Search manually by city or region. We will open the closest matching local forecast—no location permission needed.
Try “Fairbanks”, “Yellowknife” or another nearby place.
What the colors mean
Modeled oval intensity
Brighter colors indicate stronger modeled auroral activity directly overhead at that grid point. They are not a local viewing probability.
What is missing
Your sky conditions
OVATION does not account for cloud cover, local darkness, moonlight, light pollution, terrain or an obstructed horizon.
How to decide
Pair map with location
Open a local forecast to combine geomagnetic activity with cloud and location context before making a viewing or travel decision.
Four signals, one viewing decision
Turn the live oval into a practical plan
The global map shows where auroral activity may occur. Combine it with live space weather, darkness and your local sky before deciding to go.
Read the oval
Check whether the modeled auroral oval reaches your magnetic latitude and verify the forecast timestamp.
Check Kp and Bz
Use Kp, solar-wind speed and Bz as supporting context—not as a local visibility guarantee.
Confirm darkness
Aurora needs a sufficiently dark sky; twilight can hide activity even when the oval looks promising.
Check cloud cover
Cloud can block the sky completely, so open the forecast for your nearest location before leaving.
Go or no-go
- GO
- The oval is relevant to your latitude, the image is current, the sky is dark and local cloud is limited.
- NO-GO
- The model is old or unavailable, the oval is too distant, daylight remains, or local cloud blocks the sky.
Choose the right hemisphere
- Northern Hemisphere
- Use this map for aurora borealis around the Arctic and northern mid-latitudes.
- Southern Hemisphere
- Use this map for aurora australis around Antarctica and southern viewing locations.
Global viewing context
Use the same map differently at each latitude
Your magnetic latitude changes how close the oval must move before aurora becomes plausible. Always finish with a local forecast.
High-latitude viewers
Inside or near the auroral zone, low Kp can still produce visible aurora when darkness and cloud cooperate.
Mid-latitude viewers
Look for a stronger expansion of the oval, elevated activity and a clear, dark horizon toward the pole.
Southern viewers
Switch to the Southern Hemisphere map and use the same activity, darkness and cloud checks for aurora australis.
Continue with local conditions
Popular Aurora Countries
Move from the global oval to local forecast hubs with cloud, darkness and destination context.
COUNTRYUnited States⌖ 1593 forecast locations COUNTRYCanada⌖ 2188 forecast locations COUNTRYNorway⌖ 404 forecast locations COUNTRYFinland⌖ 836 forecast locations COUNTRYSweden⌖ 499 forecast locations COUNTRYIceland⌖ 42 forecast locations COUNTRYGreenland⌖ 16 forecast locations COUNTRYUnited Kingdom⌖ 409 forecast locations COUNTRYAustralia⌖ 24 forecast locations COUNTRYNew Zealand⌖ 195 forecast locations COUNTRYArgentina⌖ 23 forecast locations COUNTRYChile⌖ 9 forecast locations
Data freshness and method
Know what the live map can—and cannot—tell you
Aurora Hunt displays public NOAA SWPC OVATION imagery and space-weather observations, then keeps local visibility decisions separate from the global model.
- The OVATION image is a 30-minute forecast and is checked about every five minutes; all timestamps are shown in UTC.
- Kp, Bz and solar-wind speed add context, but clouds, darkness, moonlight, light pollution and horizon access still decide local visibility.
- Method reviewed by the Aurora Hunt editorial team on September 1, 2026.
Map essentials
Live Aurora Map Questions
Clear answers for turning a global model into a better viewing decision.
What does the live aurora map show?
The map shows NOAA SWPC’s OVATION model of the auroral oval for the Northern or Southern Hemisphere. Brighter colors indicate stronger modeled auroral activity at that location, not a personalized chance for your address.
How often does the NOAA aurora map update?
NOAA normally refreshes the forecast image about every five minutes. Aurora Hunt checks for a new image on the same cadence and shows the forecast timestamp in UTC so you can verify freshness.
What is the difference between the North and South maps?
The Northern Hemisphere map covers aurora borealis around the Arctic, while the Southern Hemisphere map covers aurora australis around Antarctica. Choose the hemisphere that matches your viewing location.
Does a bright auroral oval guarantee I will see the northern lights?
No. OVATION does not include cloud cover, local darkness, moonlight, light pollution, terrain or an obstructed horizon. Pair the global map with a local forecast before deciding where or when to go.
How does the Aurora Hunt app improve on a global map?
Aurora Hunt combines space-weather context with local cloud, darkness and location data, then delivers smart alerts when conditions near you become more promising.
Catch the Aurora, Every Time
Stop guessing and start seeing. Receive instant push alerts the second the northern lights are actually visible near you, backed by real-time cloud and solar wind models. Your daily forecast is completely free.
Data-backed forecasts Alerts in seconds Cosmic insights